Background
The Brain Gauge technology was first conceived by two members of the medical school faculty at the University of North Carolina, Bob Dennis and Mark Tommerdahl. It is our goal to develop a technology that will allow not only scientists but also individuals to have an affordable and accurate way of investigating brain health. It is our belief that individuals should be able to assess their own brain health much like they are able to evaluate heart rate and blood pressure.
Why is the Brain Gauge based on the sense of touch?
The somatosensory system is well suited for testing the central nervous system (CNS) because it is organized so that adjacent regions on the skin project to adjacent cortical regions. Tactile stimuli can be precisely controlled and delivered to these regions and it is easy to control for distractions (as compared to controlling for distracting visual or auditory input). More than 50 years of neuroscience research have yielded a great deal of information about the nature of the interactions within and between the adjacent cortical regions as they are activated by tactile stimuli. This includes three decades of our own work, which has helped to build the foundation for understanding certain aspects of brain function and how to test for it.
While medical imaging is a useful tool for identifying whether relatively large areas of the brain are injured, cortical metrics are very good at identifying subtle changes in brain function. For example, the sedative that many people are given to reduce anxiety before being scanned would have a significant impact on cortical metrics but no impact on the medical image.
How does the Brain Gauge work?
One of the underlying principles of the science behind the Brain Gauge is that the nerves in adjacent fingertips project to specific and unique adjacent regions in the brain. The Brain Gauge sends gentle vibrations to your fingertips to precisely activate these nerves and areas in the brain. When adjacent regions are activated, they interact with each other in predictable patterns that affect your perception of how the vibrations feel. By changing the vibrations in specific ways and then asking questions about what you feel, we can measure the percept created by the interactions and predict how well the mechanisms behind these interactions are working.
You’re probably familiar with tasks that are similar in design to Brain Gauge tests but are based on sight or hearing rather than the sense of touch. Using a Brain Gauge is like reading an eye chart: as you answer the questions correctly, the successive questions become more difficult in order to approach your limits of detection. Some of the tests even involve illusions such as the tactile equivalent of the visual illusion below.

In this image, the center circles of each cluster appear to be different sizes, when in reality, the circles are the same size. This context-dependent illusion is the result of a number of neural mechanisms being intact. In other words, if there was something wrong with an individual’s CNS health, then they would not observe the illusion and their assessment would be more accurate than that of an individual who was not impaired. Thus, this would be a condition in which a CNS-impaired individual could outperform a healthy individual. This phenomenon is embedded in the Brain Gauge system, which, in part, uses illusions of touch to quantitatively assess the degree to which CNS health impacts an individual’s perception.
History
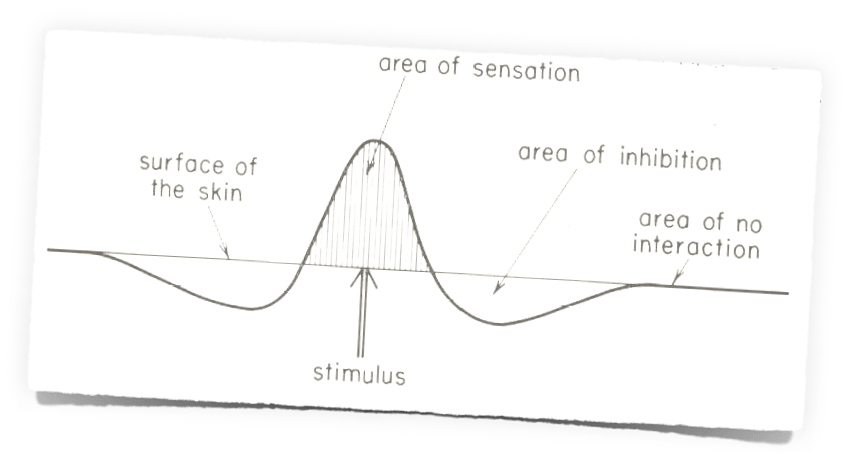
Nobel Prize winner Georg Von Bekesy identifies a significant mechanism of CNS information processing via sensory perceptual tests. Lateral inhibition is predicted to modulate information that projects to adjacent and near-adjacent areas in the brain.
Lateral inhibition, in its simplest form, means that when you stimulate two fingers, two places in the brain that are beside each other “fight” with each other. This “fight,"" or integration of information, is what determines what you feel on your fingers.
1960's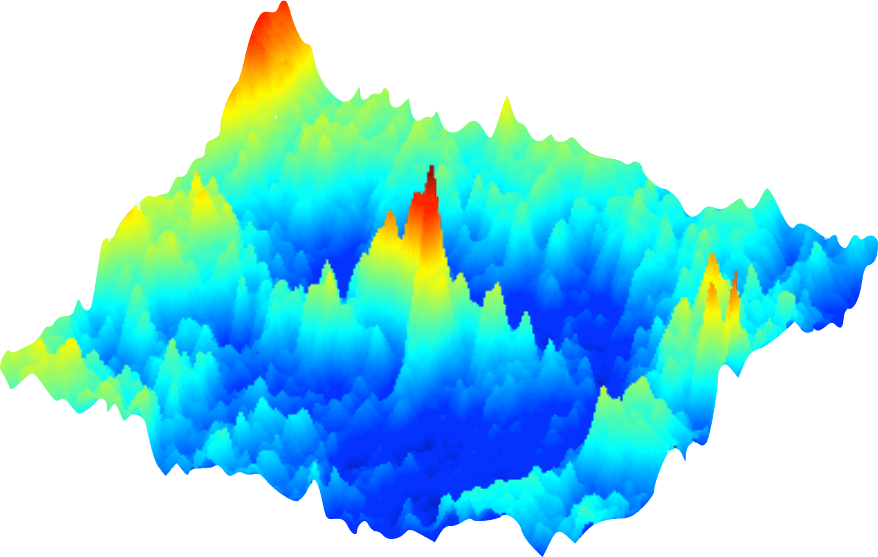
High resolution imaging studies demonstrate prominent and robust patterns of lateral inhibition form in the cerebral cortex with tactile stimulation. Additional studies show that these same patterns of brain activity are altered with pharmacological and traumatic insult.
1980's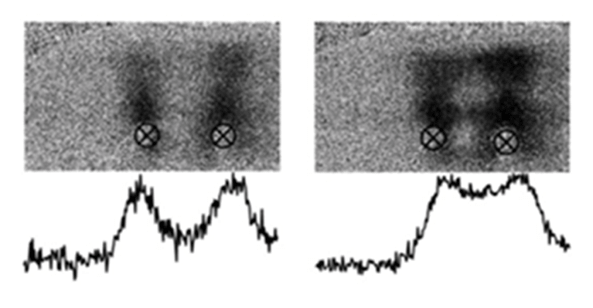
High resolution imaging studies demonstrate that small changes in the efficacy of lateral inhibition result in large changes in brain activity patterns. These studies predict that sensory percept will be altered significantly with subtle changes in the CNS.
1990's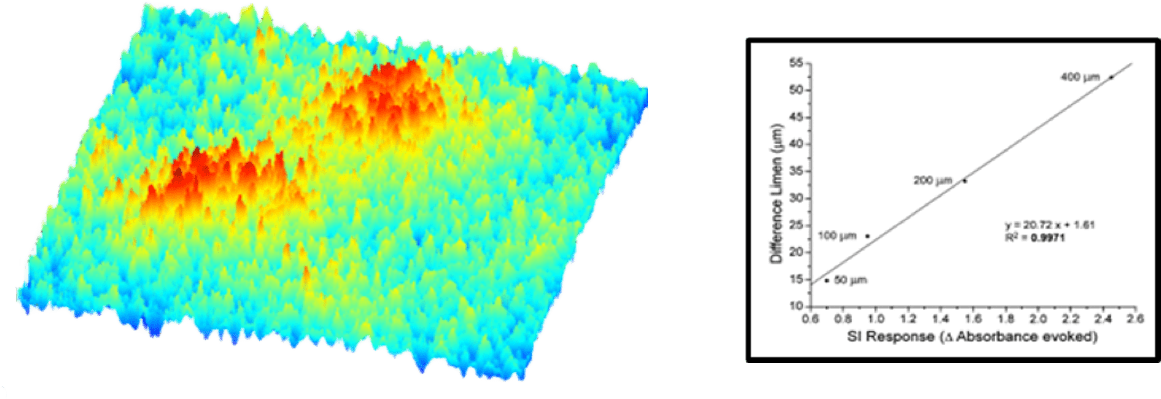
Development of cortical metrics – sensory based perceptual measures that were designed from observations of dynamic cortical-cortical interactions from neurophysiological studies. Comparison of results from cortical metrics studies to neurophysiological studies yielded 98% or better correlations.
2000's
Combining multiple cortical metrics – with each corticalmetric targeting a different mechanism or pathway – yielded 99% confidence levels in differentiating concussed from non-concussed individuals using principle component analysis (PCA). Similar success was subsequently achieved with other neurological populations: migraine, autism, alcoholism, non-headache pain and diabetes, to name a few.
2010's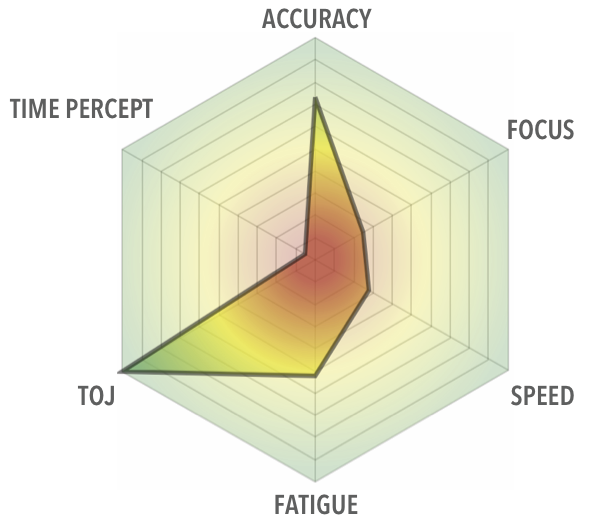
Implementation of easy-to-read results. Radar charts compare individual 2 days post-concussion vs. 8 days post-concussion. Note that graphs intuitively reflect the recovery of the individual from concussion.
2015